This post is a simple step by step guide on how to search Cloudwatch for errors on a lambda function. I find that this simple task can be confusing sometimes, at least for me, so I’m sharing what I do about this that helps me, enjoy 🙂
Steps to search:
– Go to AWS console
– Under services, select ‘Lambda’
– Search for and select the desired function name on the list of available functions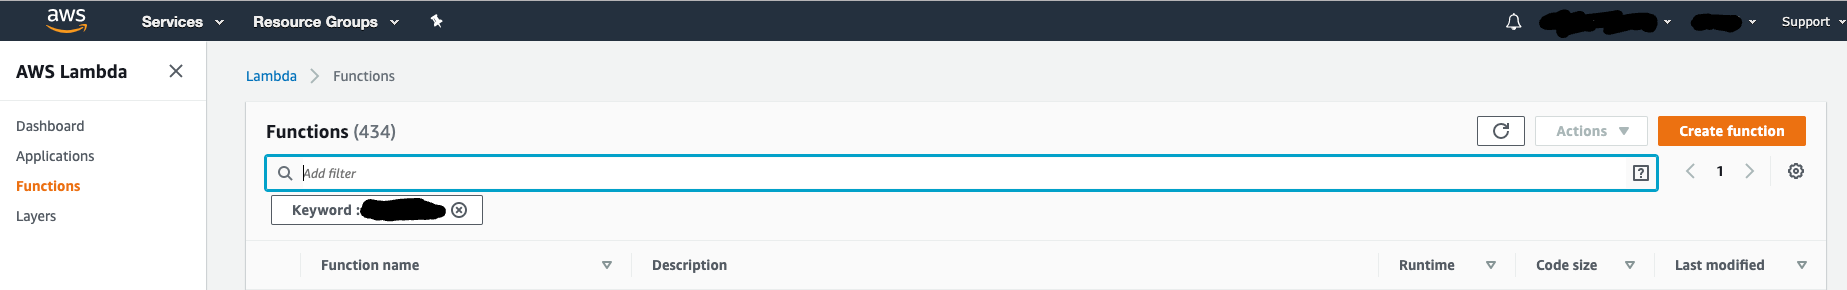
– on the function page, select the ‘Monitoring’ tab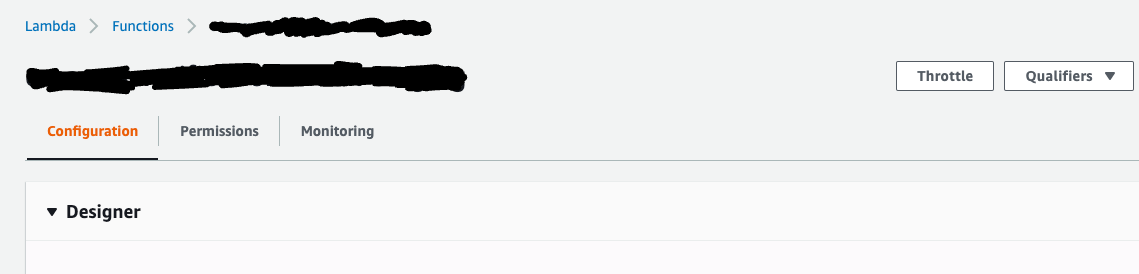
– on the ‘Monitoring’ tab, click on ‘view logs in Cloudwatch’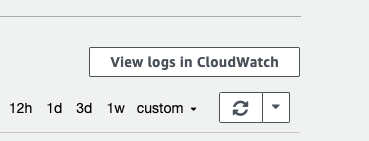
– on the CloudWatch page that you will be redirected to from the lambda page, select a log group, targeting the time when the error was encountered
NB: take note of the time zones, between when you received the error and the time of the location you are accessing/running AWS from and convert accordingly so you know what time to target for the search.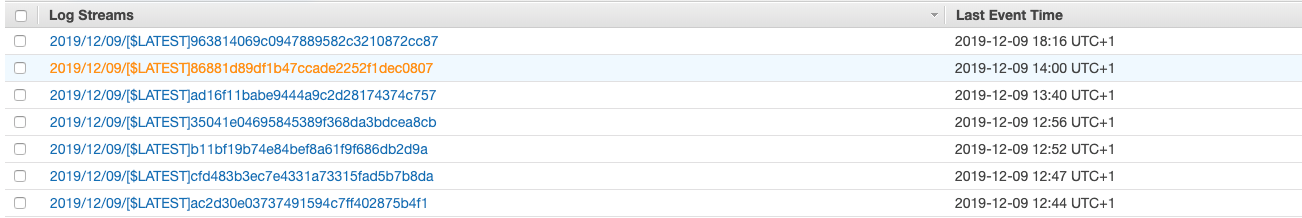
– After selecting the time frame from the previous step, you land on the log group page.
Here you can search for the desired metric. This can be an AWS lambda metric or custom metric logged by your code.
In this post, we will search for a custom metric ‘filtered’.
This string can also be “error” or any string of interest.
A search for ‘filtered’ will show you the errors that happened during the time of interest selected.
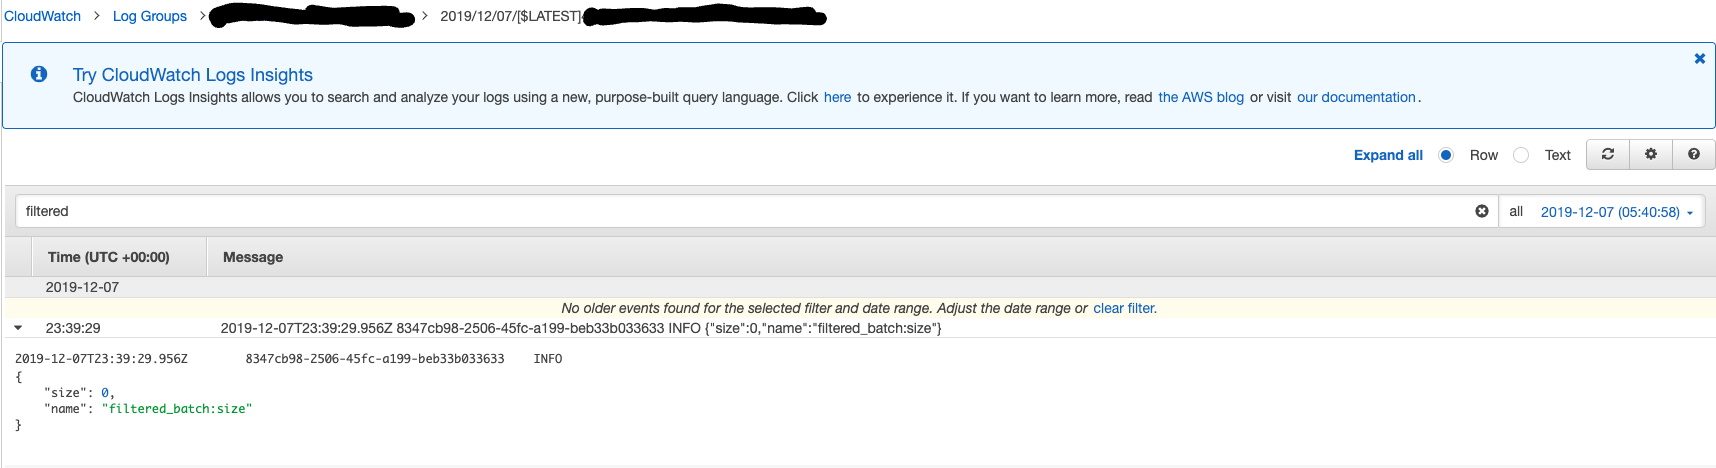
– Click on any of the results to view the details of the error or the log.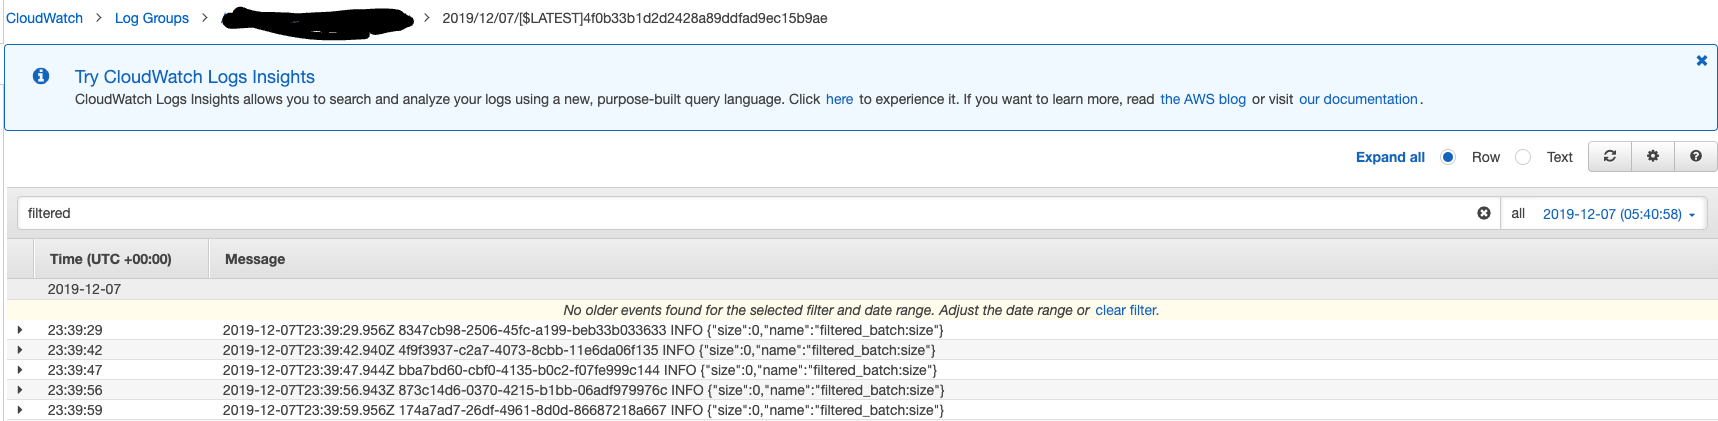
Any of these metrics can be searched for on AWS lambda
https://docs.aws.amazon.com/lambda/latest/dg/monitoring-functions-metrics.html